Environmental calculations (all calculations were made by the rector, I.V. Rizov)
CALCULATION number 1a Emission of technical CO2 into the atmosphere *
/ excluding CO2 emissions from volcanoes and forest fires ** /
Calculation 1b Mechanism for reducing atomic (ozone) oxygen
Calculation 2 The amount of actual emissions of CO and CO2 for the actual production of hydroc
Calculation number 3 Amount of water in the world and meet him in the future arbons
Calculation 4 Energy requirements for electrical (nuclear) desalination stations
Environmental calculation number 5 US military spending in Iraq
Comparative calculation number 6 Hydrocarbon fuel combustion and photoelectric sun-silicon converter (UPC) production
Calculation №7 Possibilities of expanding agricultural land in the integrated development of the Saharanid desert with Arabia and the number of jobs when introducing CEE
Calculation №8 Economic indicators of cargo transportation to MZHMP
(To use high speed train can only be single-carriage.)
Calculation number 9 Environmental tax on oil
Scheme №4 The carbon cycle in the biosphere (Gt.) (according to the book 9., p. 122)
Calculation number 10 Nuclear warhead costs
Calculation number 11 Power of the sunmobile
Necessary environmental and economic calculations
CALCULATION number 1a
Еmission of technical CO2 into the atmosphere *
/ excluding CO2 emissions from volcanoes and forest fires ** /
Name Amount of CO2,
The arrival of billion tons
1. Permanent balance in the atmosphere *** 590
2. Respiration of terrestrial animals and organisms **** 60
3. Burning fuel ***** 6
4. Marine organisms and animals 93
5. Reducing CO2 consumption 1
due to the increase in land reclamation
Total 750
Consumption
1. Photosynthesis of trees 62
2. Constant balance in the atmosphere 590
3. Absorption by sea water and flora 92
Total 744
1. Annual CO2 increase due to technical emissions in the 21st century, in%:
6: 744 x 100% = 0.8%
2. The growth of CO2 over the past 150 years, as it appeared railway transport,:
(6Gt – 0): 2 x 150 years = 450 Gt
3. The minimum number of CO2 not absorbed by the forest over the past 150 years (excluding reduced greenery due to the growth of deserts and taking into account the fact that over the last 100–200 years, the area of all forests has decreased by no less than 33%):
30Gt: 2 x / (0.4 x15 years + 0.8 x 150: 2): 2 + 0.1 x 150 years / x 0.5 = 360 Gt, i.e. The increase in CO2 from deforestation is comparable to CO2 emissions from fireboxes, where
30 Gt / year – the value of under-consumption of carbon dioxide consumption by forest for the year to the beginning of the 21st century,
30Gt: 2 – average – // – for the last 150 years,
0.4 is the coefficient of the minimum fall in the level of CO2 utilization during clear cutting, after which the forest is fully restored in 15 years or it is planted with cultivated plants that in 15 years reach the peak of their mature age (5 + 25): 2, where 5 years are cultivated bushes , 25 years old – cultural trees,
0.8 is the coefficient of the maximum drop in the level of CO2 utilization during clear cutting and transformation of the former wooded area into a desert,
0.4 and 0.8 is the average decrease in the level of CO2 processing during deforestation, depending on the type of logging, the rate of forest recovery and the amount of greenery remaining after clear cutting.
0.5 – the share of clear cutting,
0.1 – the average drop in CO2 production during selective cutting
15 years – the average duration of the restoration of greenery in the cultural clear cutting and the replacement of forest with cultivated plants.
4. The growth of CO2 due to flue and exhaust gases and deforestation:
450 + 360 = 810 Gt.
Taking into account the reduction of greenery due to the growth of deserts and an increase in areas for agricultural production, the growth of CO2 over the past 150 years should be even greater.
But part of carbon dioxide is processed by nature, how much CO2 was before the start of the scientific and technological revolution is unknown, but it can be said with certainty that over the past 150 years, CO2 has increased by no less than 50%, and maybe twice. Unfortunately, there is still no reliable scientific and comprehensive data and they need to be identified.
Thus, it is necessary not only to reduce technogenic CO2 emissions, but also not to cut down, but rather to plant, forests and urgently take measures to plant the desert, especially its edges, leading artificial water there and planting artificial forests, parks (natural and artificial), gardens, grain fields and vegetable lands, grasses, bushes, etc., since the growth of co2 due to deforestation is about the same as when burning fuel in the scientific and technological revolution.
7. The growth of CO2 emissions by the beginning of the 22nd century (assuming the amount of gas emissions at the level of 2001, ie 6Gt / year, the invariability of forest areas and deserts, i.e. ideal):
6Gt x100 years = 600Gt, i.e.
600Gt: 1360Gt x 100% = 25%
8. But, if the annual increase in production of hydrocarbons intended for combustion is at least 3% (this should be limited by international treaties), then the increase in carbon dioxide emissions over this time will increase by almost the same: i.e. by 500Gt, which means that carbon dioxide in the atmosphere will be almost 50% more compared with 2000 / (600 + 500): 2: 750 / or 120% / (450 + 360 + 600 + 500): 2 : 750 / more, that is, more than 2 times than 150 years ago, even without taking into account further deforestation and further growth of deserts (but taking into account that, like in those centuries, half of CO2 is recycled by nature). And how many of the most poisonous carbon monoxide (CO), which destroys all living things and distorts the genes of the flora (mutates), no one has counted out into the atmosphere, and it’s even scary to count.
9. If the emission rates remain current, and deforestation remains at the current level, by 2060, emissions will be:
6 x 50 + (14 – 6) x 50 + 20: 2 x0.4: 2 x 50 = 300 + 400 + 100 = 800Gt, where
14Gt – CO2 emissions by 2060,
20Gt – the level of decline in CO2 processing by the forest.
10. The growth of CO2 compared to the 19th century, excluding the growth of deserts:
(800 + 450 + 360): 2: 750 x 100% = 107%
10. Imagine the perfect option:
Until 2015, a decision was taken on radical environmental measures around the world,
2020 – prohibit the construction and launch of old thermal power plants,
From 2025 – build only new TPPs and cars (solar vehicles),
From 2040 – close all old TPPs and most of the old car plants.
From 2020 – to cut down forests only as much as he planted and raised to the age of 5 in the desert or paid the appropriate tax to targeted global funds,
Only from 2025 will the stabilization of forests begin
Only by 2050 will the trees become adults and they will fully process as much CO2 as was cut down in 2020.
Thus, even ideally, it takes about 30-40 years for the transition period from barbaric energy management methods to environmentally clean and during this time there will still be almost 2 times more carbon dioxide in the atmosphere by the middle of the 21st century than 300 years ago. .
During this time, it is quite possible with the help of the United Nations to make plans and projects for the integrated development of deserts, and even introduce the first stage of CEE, and for this you only need to annually reduce each country’s military spending by only:
5,000 billion: 25 years: 1,500 billion x 100% = 13.3%,
those. annually during the first 5 years to reduce military spending by 15% and thus reduce them during this time by half, and then the remaining funds (200 billion dollars. per year) receive in the form of UN taxes on deforestation and burning hydrocarbon fuel which should be in size:
200 billion dale : 8 billion tons of fuel production = 25 dollars per ton, which is now only 20% of taxes per ton. oil, for example, in Russia, 5% of the current world price ($ 500 per ton) for oil or 3% for the price of oil ($ 900) in 2008 and not a single cent of this huge price for environmental needs, and only in the pockets of stockbrokers, dealers and speculators of oil, not to mention gasoline.
All other stages can be carried out in a commercially-centralized form. They will no longer present difficulties for the MFES.
____________
* – all calculations according to scheme 4 (according to book 9, p.122)
** – settlement scheme is very simplified.
*** – without taking into account the peculiarities of decay in the northern (coniferous) and tropical forests.
**** – without taking into account the peculiarities of rotting and respiration of soil microorganisms in cultural plantings and wild places.
***** – according to approximate data at the beginning of the 21st century.
Calculation 1b
mechanism for reducing atomic (ozone) oxygen
When the carbon monoxide and sulfuric gas are released from the fireboxes, according to the author, two types of chemical reactions occur in the atmosphere, resulting in the formation of acids.
1st option:
1. CO + CO + H2O = H2CO3 + C,
2. SO2 + SO2 + H2O = H2SO4 + S.
Option 2:
1. CO (flue gas) + Н2О (atmospheric water) = Н2СО2,
H2CO2 + O (atomic oxygen) = H2CO3 (carbonic acid).
2. SO3 + H2O + O = H2SO4.
But part of the carbon monoxide molecules reaches the ozone layer, where they combine with atomic oxygen:
2. CO + O (ozone layer) = CO2
Thus, according to the author, the decrease in atomic oxygen occurs in the lower layers of the atmosphere and in the upper layers, that is, in the ozone layer, and therefore the ozone layer is rapidly decreasing (but we do not know this: how much?), Which increases the passage of ultraviolet rays through the atmosphere and their number, falling on the earth’s surface, which in turn causes cancer in humans, changes the genetic foundation of all life on Earth.
This gas (CO) is the most dangerous consequence of the combustion products of hydrocarbon fuels, as it causes two negative consequences at once: acid in the atmosphere and a decrease in the ozone layer, which together affect all life on the planet, up to a genetic mutation: microbes in the air, in the soil and in water, on flora and fauna, including on the human genome.
Because of this, there may be new types (stamps) of influenza and other microbes and viruses, dozens of old contagious diseases are returning, but with different properties, etc. and the like. Probably, therefore, in recent years, new types and forms of viral and microbial diseases have emerged: avian and swine flu, new types of malaria, etc. etc., many of which we do not yet know, until someone gets sick, since research is not being conducted in this direction either.
Calculation # 2
the amount of actual emissions of CO and CO2 for the actual production of hydrocarbons
1. The actual average oil production per year (for 2000-2010) – 5 billion. t.
2. Non-combustible part (bitumen, etc.) – 1 billion. t.
3. In fact, burned – 4 billion. t.
4. The amount of produced gas – 4 trillion. m3 (billion tons)
5. The amount of carbon produced in the gases is 2.5 billion tons.
6. The amount of coal mined and burned is 1.3 billion. t.,
– The amount of carbon in the gases is 1 billion Gt.
7. The amount of wood burned is more than 3 billion m3 (more than 2 billion tons).
8. Total hydrocarbons burned – 8.5 billion tons
The amount of carbon emitted in carbon dioxide and carbon monoxide entering the atmosphere when hydrocarbons are burned is actually not 5.5 Gt, as shown in Scheme 5, but, as we see, more, because in the first place the combustion of firewood and branches.
9. The amount of carbon monoxide will actually be twice as much:
8.5 billion tons (C) x 2 = 17 billion tons (Gt.) (CO2) = 17 trillion m3 (CO2)
Consequently, according to our calculations, carbon dioxide in the atmosphere is much more than in the table above, and carbon monoxide is emitted around:
– 17 Gt. X 0.24 = 3.5 Gt. (C) = 3.5 trillion m 3 gas CO,
where 0,24 – the average ratio of carbon monoxide in the combustion products and it is equal to:
(1% + 10% + 20% + 30% + 60%): 5: 100 = 24%
1% – the content of carbon monoxide during combustion of natural and similar gas and in closed electric wires,
10% – when burning in open electricity,
20% – in various open fire chambers,
30% – in diesel ICE,
60% – gasoline engine.
10. If at least 10% of the carbon monoxide emitted into the atmosphere does not combine with water, then in the atmosphere it will combine with ozone during thunderstorms:
3.5 Gt x 0.1 = 3.5 trillion m3 x 0.1 = 350 billion m3
If at least one percent of carbon monoxide that does not combine with water, that is, only a thousandth of the total carbon monoxide emitted by man, does not combine with water and ozone in the atmosphere and reaches the ozone layer, then it will be:
350 billion m3 x 0.01 = 3.5 billion m3
11. Size of the ozone layer:
– 4pr2 x t = 3, 14 x 4 x r2 x 0.003 m = = 3x4x7000km.x1000x7000km. х1000х0.003 = 1.8 trillion m3,
where r is the radius of the ozone shell, equal to:
r = R + h = 7000 km.,
where: R is the radius of the Earth, h is the height of the ozone layer above the Earth?
t is the thickness of the ozone layer.
12. Time of destruction of the ozone layer:
1.8 trillion m3: 3.5 billion m3 / year = 514 years
Consequently, as soon as carbon monoxide becomes more than atmospheric water can neutralize it into acid, then after it becomes more than ozone is released in the atmosphere during thunderstorms, after 500 years the ozone layer may disappear.
Considering that about 30-50 years ago, the ozone layer began to decline noticeably, then in 150-200 years it will be only half, and this is practically a catastrophe for all life on Earth. But since we do not know the actual amount of CO emission, this may occur in the 21st century.
To reveal the actual picture today, we need the following studies:
– direct measurement of the volume of reduction of the ozone layer (OS),
– counting the actual release of CO,
– determining the amount of ozone released during thunderstorms and its mechanism for combining with CO,
– determining the amount of CO combining with the ozone of the atmosphere,
– determination of the causes and amount of CO reaching the Ozone Layer.
Thus, at least 4.5 billion tons of acids are created annually in the atmosphere from the combustion of various hydrocarbons, which fall on the earth, rivers, seas and oceans, destroying everything in their path and ozone (atomic oxygen) decreases first in the atmosphere , ie, the atomic oxygen released during a thunderstorm is immediately combined with carbon monoxide gas constantly present in the atmosphere and practically does not reach the ozone layer in the upper atmosphere, and that carbon monoxide that reaches the ozone layer connects there with atomic oxygen and destroys billions of years, the ozone layer.
Nature created the ozone layer for billions of years, and the man of the last 300 years began to destroy it and in the 21st century can destroy it altogether, in one place – and himself.
Calculation number 3
amount of water in the world
and meet him in the future
1. Water consumption per day per person in all types of activities (excluding agricultural expenditures /: 300
2. Water consumption per person per year:
300 l x 365 = 110 m3 (t)
3. Consumption for the normal functioning of the population:
110t x 7 billion people = 770 billion tons
4. Amounts of ice in glaciers: 15.5 million km3 *
5. The amount of drinking water needed per year per person:
5l x365days = 1825l
6. Time spent by the glaciers on drinking water:
15 million km. 3 x 1 billion x 0.8: 1.8 t / person-year: 7 billion people = 950 thousand years
7. Time spent by glaciers on domestic water:
15 million km3 x 1 billion x 0.8: 50m3 / person-year: 7 billion.
people = 354tys. years old.
Thus, the glaciers are huge reserves of clean water and, if they disappear, the water security of mankind will fall sharply.
If you even carry water from glaciers into deserts and semi-deserts for drinking and even agricultural water, plant deserts and thereby reduce the CO2 content in the atmosphere and glaciers stop melting, then even at any delivery price, it will be beneficial glaciers and water security of the Earth.
Even if we manage to preserve the third part of the glaciers (5 million km3) of glaciers, then it will be enough for 10 billion people for all needs:
5 million km3 x 1 billion (m3): 10 billion people. : 200 m3 / year = 2.5 thousand years.
Otherwise, they will mix with salt water in akeanah.
Thus, the melting of the ice of the Arctic and Antarctica, a decrease in the ozone layer in the atmosphere and acid precipitation are the most dangerous consequences of the anthropogenic influence of man on the GIK.
_____________
* – according to approximate data at the end of the 20th and the beginning of the 21st century.
Calculation 4
energy requirements for electrical (nuclear) desalination stations
1. The amount of desalinated water per kilowatt-hour – 6l.
2. The amount of desalinated water from the electricity of nuclear reactors:
10 billion kW *. x 6l / hour = 60 billion. l / h (60 million t. / h) = 1,440 billion l / day.
3. The number of people completely, incl. and irrigated agriculture, i.e., water supply:
1,440 billion liters: 500 liters = 3 billion people, where:
100l – for domestic needs, 100l – for urban maintenance, 300l – for food and clothing in irrigated agriculture in semi-deserts, steppes and savanna.
Thus, if nuclear fuel instead of warheads were aimed at creating nuclear weapons in the NF, they would provide water and food for an additional 3 billion people or 2 billion people with full energy in deserts and semi-deserts, turning them into flowering oases: and parks with developed irrigated agriculture (in North Africa and Arabia – 1 billion people. And in Central Asia – 1 billion.), which is now not enough in the world even in other, better climatic conditions. Consequently, the current 2 billion people live poorly because of the thermonuclear race unleashed in the world in the second half of the 20th century, according to the author of the USA
.
___________________
* – the total capacity of NPS, which could be built from ore for nuclear warheads, see further in the calculation №10.
Environmental calculation number 5
(US military spending in Iraq)
In Iraq and Afghanistan over the past 15 years (1996-2010), only the United States has spent at least $ 300 billion. for military spending, i.e. an average of 20 billion a year *.
! Option: Providing desalination water and electricity.
1. The installed annual capacity of NPP and AOC from possible such investments:
– 10 billion dollars. : 1000 dollars = 10 million kW. NPP,
where 1000 dollars – the average cost of building capacity of 1 kW. in nuclear power plants (1 watt = 1 dol.),
– 10 million kW. x 6l x 24 hour = 1 440 million liters / day,
– the number of people provided with drinking water:
1440 million liters. : 100l = 14 million people
Thus, only half of the military expenditures invested in nuclear power plants in one year will give electric current for desalination of drinking water to practically the entire urban population of Iraq.
2. The area of photovoltaic cells generated from such investments per year:
– 10 billion dollars. : 10 thousand dollars. / m2 = 1 million. m2,
where 10 thousand dollars. – the cost of production of 1m2 UPC.
3. Installed power solar flint converters (UPC):
– 1 million m2 x 0.4 kW. / m2 = 400 thousand. kW,
Where 0.4 kW. / m2 – the average power of electricity converted from solar in the area.
4. The amount of desalinated water per day in SOS:
400 thousand kW. x 10 l x 24h = 96 million liters / day,
Where 10 l / h – the performance of 1 kW / h DC.
5. The rural population (without animals) served by drinking water from an annual investment of 10 billion dollars. in UPC:
96 ppm : 40l. = 2.4 million people or 36 million in 15 years
where 40 l. – the rate of consumption of drinking water in rural areas (without central water supply).
6. The number of people in rural areas served by electricity (water heating, cooling of the room, desalination of sea water, a pump for shallow groundwater: wells, etc., a pump for deep waters for the whole village, etc., etc. ) from UPC:
400 thousand kw. : 0.25kw. = 1.6 million people
where 0.25 kW./pers. – the norm of installed electricity capacity for normal living in rural areas in local conditions.
7. The number of rural people with electricity and fresh water for 15 years, half of the investment in UPC:
– 1.6 million people. X 15 years = 24 million people.,
which is approximately equal to the entire population of a country that does not have a central water supply.
8. The amount of desalinated industrial water and water for agricultural production (14 nuclear power plants of 10 million kW each, without the cost of AOC):
9. 1440 million liters x 14 years = 20 billion liters / day
10. Number of people provided with food and technical crops from drip irrigation in the desert:
20 billion liters: 500 = 40 million people.
Thus, for the same costs (300 billion dollars), the United States could build nuclear power plants with a total capacity of 100 million. kW., most of the electricity generated is directed to desalinating seawater of the same OS capacity and supplying drinking water to 40 million people, that is, almost the entire population of Iraq, and giving electricity to 4 million rural people, improving life and production (drip irrigation) about 40 million inhabitants (without taking into account the cost of agricultural and other infrastructures), i.e. for 15 years they could radically improve the urban water supply and the power supply of the rural population and Iraq would not need to burn for this a single gram of hydrocarbons, and mean t improve and power the entire country in abundance, but instead the war the Western allies brought devastation, instability and famine.
!! Option: Integrated introduction of new technologies for CEE
NO and TFR for the integrated development of the desert – 5 billion dollars.
Construction of two nuclear power plants for 5 million. kW – 10 billion dollars.
Construction of a sand processing complex (POC) * with a capacity of 2 million tons of enriched sand per year – 10 billion dollars.
Construction of AOS with a capacity of 1 million tons of water per day – 2 billion dollars.
Integrated plant for the coating of concrete products photoelectric silicon:
– 1 mln. ton converters. silicon (the cost of production of 1 trillion. dol.) a year – 25 billion dollars.
– Silicon-coated concrete goods – 25 billion dollars.
6. Breakdown of parks and gardens around mills and agricultural development – 5 billion.
7. Construction of two-way railway. on a magnetic cushion from the sand-dressing plant to concrete products from SBOK and to a specialized seaport for transporting enriched sand and concrete goods from a safety terminal with a length of 600 km. (Baghdad – POK – combine SBOK – Special Container Sea Port SKMP):
– 50 million dollars / km. x 600 km. = 30 billion
– 4 stations – 20 billion
8. Construction of automotive infrastructure – 5 billion.
9. Construction of a special port (SKMP) and vessels with container transportation of enriched sand, flint sheets and ingots, and concrete goods from SBOK – 50 billion.
10. Third of the first option – 100 billion.
Total: 287 billion dollars.
So we see that by making a mixed investment, the United States could turn Iraq into an exemplary country to introduce advanced environmental technology, but instead they have what they have and want.
This could have now, if the United States and its allies would cut their military spending by a third, and then, in just three years of saving military funds, they would have the means to implement both versions of the project.
__________________
* – without taking into account the costs of the CIA, the State Department, public and charitable organizations and other costs unknown to us,
Comparative calculation number 6
hydrocarbon fuel combustion and photoelectric sun-silicon converter (UPC) production *
1. The amount of energy contained in 1 kg. hydrocarbon fuel (kerosene) – 6 thousand kcal.
2. Power 1kg. photoelectric silicon 1mm thick .:
– 1 kg. : 10kg x 1m2 x 0.5kw. = 0.05 kW. (50W)
– 6 000 kcal. X 1.16: 50 Tues./hour = 139h,
After such a time 1kg. silicon will produce as much solar electricity.
3. Number of energy per year:
0.05 kWh 8760 hours = 438 kWh = 438 thousand W / hour
4. The cost of electricity generated per year:
438kv.ch x 0.1 dollars. = 43.8 dollars.
5. The amount of energy for melting one kg of silicon – 2000 * Gcal. (6 million kcal)
6. The amount of hydrocarbon fuel required for melting 1 kg. silicon:
2 million kcal : 6 thousand. Kcal. = 333 l
7. The cost of hydrocarbon energy for melting 1kg. silicon:
333l x 0.5 dollars. = 167 dollars.
8. The payback period of silicon photoelectric converters for CO2:
167: 44 = 4 years
those. after 4 years, the PCB will be environmentally friendly.
9. The economic payback period of the PSC 1kg. :
1000dol. : 44dol. = 23 years, where
1000 dollars – the price of 1kg KSP.
Thus, when using PSC, after 4 years we begin to receive savings (reduction of emissions) of carbon dioxide, and after 20 years – full payback of photoelectric converters, that is, after 20 years we get energy for free, and since the photoelectric element itself can work hundreds of even a thousand years, then, if in 100 years you replace carbon electric power with flint, then in 20 years all energy will be almost free and no CO2 emissions
______________________
* – approximate data
Calculation №7
possibilities of expanding agricultural land in the integrated development of the Saharanid desert with Arabia and the number of jobs when introducing CEE *
Development of 10% of desert areas **:
10 million m. X2.5 million. M: 10: 100 thousand. m2 = 25 million hectares
2. The number of people provided with food and technical crops from these irrigated areas:
25 million ha x 8 people = 200 million people
3, The number of people providing agricultural products at 20% of the agricultural development of the areas of Saharanis: – 400 million. people
4. The number of imported food due to the income from CEE: – 200 million. people
5. The number of jobs in the integrated development of these deserts and the construction of the Sahara Railways:
– construction and maintenance of 20 NPP and 100 KOS with electric networks and water mains – 1 million. people
– 20 flint metallurgical plants with associated metalworking plants – 1 million. people
– 100 factories of concrete products and PVC with assembly and construction organizations – 10 million people.
– construction and maintenance of SZHMP – 15 million people, incl. outside the Sahara – 10 million people.
– 2 ocean ports – 2 million. people
– construction and maintenance of automotive and urban infrastructures – 50 million people.
– agricultural production of 25 million hectares and its maintenance, afforestation ** and environmental protection – 50 million people.
Total: more than 100 million. work places.
6. The number of additional population (unemployed women and children): 150 million people.
7. Prospective population growth in the 22nd century – 150 million.
Thus, the integrated development of the Saharanis Desert and Arabia can yield about 100 million in the 21st century. jobs, one and a half times improve the living standards of the current 400 million population and the growth of the population by as much. And the integrated development of mountains and other deserts in the 21-22 centuries – the growth and employment of another half a billion people directly in them, as many (1 billion) in other parts of the world.
_______________
* – according to 2010 data
** – it should be noted that forest plantations in desert and semi-desert conditions (along the perimeter of deserts) will have a specific character (this should be practically not forest-forestry, but parkland, that is, with constant care of them) and will require new technologies not only agricultural production, but also in them, which n turn, it will require a lot of funds and permanent jobs not only for planting them (about 15 million hectares), but also to maintain in conditions of the desert and semi-desert, including systematic automatic watering and can be including wild forests and shrubs .
Calculation №8
economic indicators of cargo transportation to MZHMP
To use high speed train can only be single-carriage.
1. The current cost of transportation of concrete products and sand / except
Aviation / – 10 cent / kg per 100 km. or $ 100 for 1 ton per 100 km.
2. Cost * 1km MZHMP / cm. Fig.15 and 17 / – 100 million. dale on km or 10 billion dale per 100 km. / together with the wagons and all station structures /.
3. The depreciation period of MZHMP is at least 100 years.
4. Amortization value – 100 million dollars. in year. 100 km.
5. The value of the payload of one car – 10 tons.
6. Time and distance between two cars – 2 minutes. and 20 km.
7. The number of cars on the World Railways network is 50 thousand.
8. Transportation speed is 600-1000 km / h.
9. Transportation time per 100 km. – 10 min.
10. Amount of depreciation on 1t. cargo per 100km. :
$ 100,000,000 : 10t: / 366 x 24h x60 min: 10 min / = 190 dollars on 1t / 100 km.
11. The total price of transportation of 1 ton of cargo per 100 km. taking into account electricity consumption, salaries and overhead costs:
a) Electricity consumption for the movement of the car:
5000 kW x0.17 hour: 10 t. x 0.2 dale / 1 kW.ht = 17 dale / t. per 100km.
If the outer surface of the cars will be made of flint converters, which will give all the necessary current inside the car, then the total energy consumption will decrease by about three.
b) Other expenses: electricity, salary, overhead, etc. – 100 dollars.
Total: about 300 dollars.
Calculation number 9
environmental tax on oil
1. The average amount of oil produced per year:
84 million barrels x 365 days = 30 billion barrels per year = 5 billion tons. Year
2. The size of the tax on oil per year:
$ 15 x 5 billion t = 450 billion
3. The amount of forest planted in the forest-steppe and savannah per year:
450 billion dollars : 100 thousand dollars / ha = 4.5 million hectares,
This means that for 3 years with this money you can plant a forest around the African deserts of 15 million hectares of savanna forest 50 km wide. and for 10 years (the cost of planting greenery in the desert will be at least 2 times more due to their constant irrigation, otherwise they will not survive) to plant trees on 25 million hectares of desert (10% of the area of deserts), and the price of oil will increase by only 3.5 %. / 15dol.: (70dol.: 160x1tys.) X% / 100
Thus, if each of the producers, processor and intermediaries pay an environmental tax from their net income in the amount of 3-4% of their value added (or transfers 3-4% VAT on environmental needs, and not to bureaucrats and the military), then only For 15 to 20 years, it is possible to stop the growth of deserts and the reduction of forest areas throughout the world and create an ecological balance between produced and consumed carbon dioxide. The same tax must be introduced in other industries that burn hydrocarbons: the burning of natural gas, coal, peat, shale, firewood, and others.
Scheme №4
The carbon cycle in the biosphere (Gt.)
(according to the book 9., p. 122)
Calculation number 10
nuclear warhead costs
The number of warheads – 30 thousand
The minimum amount of nuclear fuel in the warhead is 3kg.
The maximum amount is 300 kg.
The average amount of fuel in one warhead produced is 10kg.
Amount of nuclear ore going to a nuclear energy reaction:
10kg. x 10 x 30 thousand = 3 million kg ..
Where 10 is the ratio of obtaining nuclear warhead and the concentration of nuclear fuel in a nuclear reactor of a nuclear power plant (3%: 20% or more)
6. Consumption of nuclear energy fuel for poison. reactor (YAR) with a capacity of 300 thousand kW. for 20 years – 100 kg.
7. Number YAR power of 300 thousand kW.
– 3 million kg. : 100 kg. = 30 thousand Yar
– total power – 300 thousand kW. x 30 thousand YAR = 9 billion kW.
In addition, about 2 million kg remained in the reserve. poison. fuel, i.e. almost as many YARs (with a total capacity of 6 billion kW) could be built, and thus the total YAR power could be:
-9 billion + 6 billion + 0.25 billion = 15, 25 billion kW.,
where 0.25 billion is the current installed capacity of all YARs in the world,
– increase nuclear power:
15.25 billion: 0.25 kW. = 61 times
ie, it was possible to build nuclear fuel for this nuclear fuel 61 times more than it is now or
– it would be possible to increase the production of electricity compared to the production of it now by all kinds of 20 times:
– 15.25 kW : 2 billion = 7, 6 times or
taking into account the burning of wood and other types of energy – 7 times.
The world community can reach such a level of power generation, if it survives this period, only by the beginning of the 22nd century, that is, after 200 years, and all this because of the nuclear-missile race imposed on the world by the West and first of all the USA.
8. The cost of one submarine, the production technology of which is identical to the production of nuclear power plants, from 16-24 poison. warheads – 16 – 30 billion dollars. USA
9. Number of NPP capacities instead of a submarine:
16 billion: 1000 dollars. = 16 million kW.,
where the cost of one kW. NPP installed capacity
10. Total number of NPP capacities instead of submarines:
! 6 million kW x 150 = 2 billion .. 400 million thousand kW. NPP
Thus, only instead of submarines, hundreds of nuclear power plants could be built with a total capacity of over 2 billion kWh, which would increase electricity production more than twice.
Approximately the same picture with other nuclear carriers.
Calculation number 11
power of the sunmobile
1. The area of illumination by the sun in a large passenger car and a minivan-type car (minivan) – 6 m2
2. Average power of converted solar energy for subtropical latitudes:
0.7kW / m2 x 0.5 = 0.35 kW / m2, where
0.5 is the average coefficient of solar brightness in subtropical and middle latitudes during the day compared to the maximum brightness at the equator,
0.7 kW / m2 is the maximum power of received electricity from 1m2 at the equator when the rays are perpendicular to the surface of the converter.
3. The amount of received power from solar energy:
0.33 x 6 m2 = 2kW.
4, Similar capacity of the engine:
2 kW x 1.2 x 4 x 3 x 1.4 x 1.4 = 58 hp, where:
1.2 – conversion factor to hp,
4 = 0.8: 0.2,
0.8 – efficiency. Electric motor,
0.2 – efficiency. ICE with gearbox,
3 – the amount of relief for the weight of the electric vehicle compared with the engine and transmission,
1.4 is the magnitude of the decrease in aerodynamic drag of the solar vehicle in comparison with a case with internal combustion engines,
1.4 is the magnitude of the increase in the friction coefficient of the solar vehicle *.
If you make and glass of KSEP, then its capacity will increase by at least 50%, as in buildings and structures.
Considering that the majority of such cars cost at least half of the light time, and microcars cost up to 80% of their daytime, even without a night electric refueling of energy and the power of solar vehicles will be enough to completely replace the already outdated environmentally friendly cars with ICE.
The same can be replaced by buses and railway. trains with ICE for power supply with KSEP. Capacities of such buses and cars with KSEP can reach:
100 m2 x 0.3 kW / m2 = 30 kW.,
which is equivalent to hp ICE:
30kW x 1.2 x 4 x 1.5 = 216 hp,
which is quite enough for the severity of these vehicles, and for a train of 20 passenger cars, the power generated by the CEP will be:
216 kW x 20 = 4320 kW.,
The electric power of a train with such cars (30 kW / h20 = 600 kW / h) is even greater for current high-speed electric trains, and there will also be more efficiency in them, since it will not be necessary to convert AC power into direct current, and the weight of the batteries will be much less than ICE.
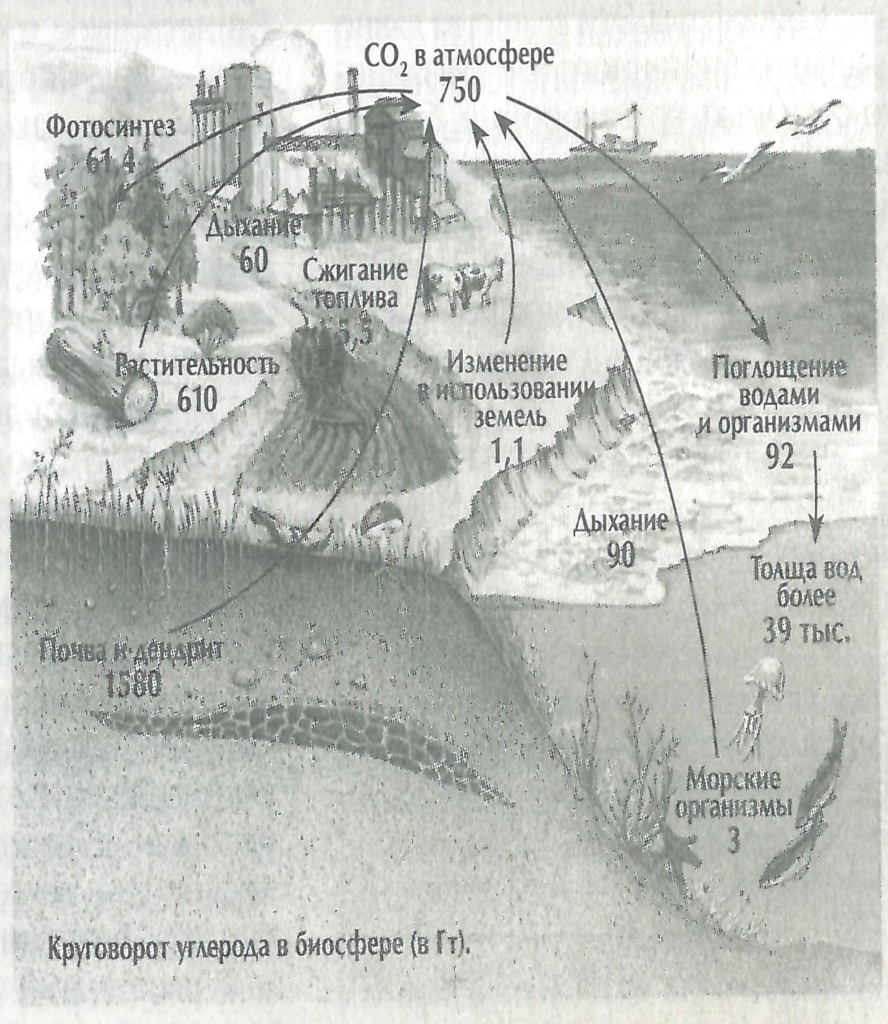
Круговорот углерода в природе (в Гекотонн) – The carbon cycle in nature (in Hekotonn).
Выделение СО2 в атмосфере: – Emission of CO2 in the atmosphere:
Дыхание:60 – Breath: 60
Сжигание топлива:5,5 – Fuel Burning: 5,5
Растительность:610 – Vegetation: 610
Изменение в использовании земель:1,1 – Change in land use: 1.1
Почва и дендрит:1580 – Soil and Dendrite: 1580
Дыхание морских животных:90 – Breath of marine animals: 90
Морские организмы:3 – Marine organisms: 3
Морские растения: более 37553,8 – Marine plants: more than 37553.8
Итого выделение СО2:39903,4 – Total CO2 emissions: 39903.4
Поглощение СО2: – CO2 absorption
Фотосинтез: 61,4 – Photosynthesis: 61.4
Поглощение водами и организмами:92 – Absorption by water and organisms: 92
Толща вод: более 39000 – Water column: more than 39000
Итого поглощение СО2:39153,4 – Total CO2 absorption: 39153.4
Итого СО2 в атмосфере:750 – Total atmospheric CO2: 750
Scheme
The carbon cycle in the biosphere (Gt.), (According to the book “BIOLOGY”, encyclopedia for children, publishing house “Avanta”, Moscow, 2006, p. 122)
Necessary environmental and economic calculations:
– economic calculation of the reduction in the cost of electricity of such cEE as compared with modern autonomous (separate) CEE stations (approximately 3 times),
– economic calculation of reducing the cost of direct current electricity from the CEE in comparison with the existing AC current 1.5 times,
– economic calculation of reducing the cost of devices and machines with direct current at least 2 times due to the lack of AC to DC converters for current ones.